Introdution
This post will be focused on how to customize the snmp_exporter config for pfSense.
Prerequisites
Before we start, it’s important to make sure some things has been done.
Enable
SNMPservice with modules on your pfSense host.- Enabled modules:
- MibII
- PF
- Host Resources
- UCD
- Enabled modules:
Test if you could get metric through
snmpwalkcommand. If not, check if there’s any rule blockUDP/161.# 192.168.11.1 in this case is our pfSense host. snmpwalk -v2c -c public 192.168.11.1 1.3.6.1.2.1.1.1.0 # It should return like: iso.3.6.1.2.1.1.1.0 = STRING: "pfSense pfsense.willyhu.local 2.7.2-RELEASE FreeBSD 14.0-CURRENT amd64"Download
BEGEMOT-PF-MIBand its imported modules. You might need to enable ssh login on your pfSense host temporarily.mkdir -p ~/Downloads/pfmibs scp [email protected]:/usr/share/snmp/mibs/* ~/Downloads/pfmibsTo build snmp_exporter and its generator. You have to install
gitandgoon your local system.Running Prometheus and Grafana server to collect and display metrics as dashboard.
Build and run snmp_exporter
- Clone snmp_exporter from github.
git clone https://github.com/prometheus/snmp_exporter.git - Build snmp_exporter and test on your local environment.
cd snmp_exporter # build, it will generate defualt snmp.yml config and snmp_exporter excution binary. make # run with default snmp.yml ./snmp_exporter - Now visit
localhost:9116to check exported metrics from web browser. For example:http://localhost:9116/snmp?target=192.168.11.1&auth=public_v2&module=if_mib. There’re 3 parameters you can change as you need.- target: The target SNMP server, in this case, it’s pfSense host (192.168.11.1).
- auth: The key name of
authsin the snmp.yml. - module: The key name of
modulesin the snmp.yml.
- The module
if_mibfrom default config should works on many devices, if you cannot see metrics be exported. Check if thecommunityis correct in the snmp.yml.
Customize the config by using generator
The default snmp.yml contains too many unnecessary modules for this case. There’s only one if_mib moudle is useful. We need to edit generator.yml and customize our own module to generate more sensible snmp.yml for pfSense.
- Build the generator and download default mibs
# make generator to download defualt mibs # you might encounter that some of the mibs cannot be downloaded now, just comment them in the Makefile and do again. cd generate make generator mibs # copy pfsense related mibs to current mibs dirctory. cp -f ~/Download/pfmibs/* ./mibs - Backup and edit generator.yml for generating new snmp.yml.
# backup original generator.yml cp generator.yml generator.yml.bak # edit generator config for custom module. vim generator.yml # generate new snmp.yml ./generator generate # you probably got error message like: "cannot find oid 'xxxxx' to walk". # that's because the generator default load mibs from `$HOME/.snmp/mibs` or `/usr/share/snmp/mibs` # you can either copy all mib files to one of those path # or run the generator with MIBDIRS variable. MIBDIRS=./mibs ./generator generate # copy new snmp.yml to parent directory. cp ./snmp.yml ../snmp-v1.yml # run snmp-exporter with new generated config. cd .. ./snmp_exporter --config.file=snmp-v1.yml # checking the new custom module on your local environment :) curl -s "http://localhost:9116/snmp?target=192.168.11.1&auth=public_v2&module=pfsense" | less - An example
generator.ymlfor monitoring pfSense host.auths: public_v1: version: 1 public_v2: version: 2 modules: pfsense: walk: - 1.3.6.1.2.1.2 # MIB2::interfaces - 1.3.6.1.2.1.31.1 # MIB2::ifMIB::ifXTable - 1.3.6.1.4.1.2021.4 # UCD(ucdavis)::memory - 1.3.6.1.4.1.2021.9 # UCD(ucdavis)::disk - 1.3.6.1.4.1.2021.10 # UCD(ucdavis)::loadAverage - 1.3.6.1.4.1.2021.11 # UCD(ucdavis)::cpu - 1.3.6.1.4.1.12325.1.200.1.1 # BEGEMOT-PF-MIB::pfStatus - 1.3.6.1.4.1.12325.1.200.1.8 # BEGEMOT-PF-MIB::pfInterface - 1.3.6.1.4.1.12325.1.200.1.11 # BEGEMOT-PF-MIB::pfLabels lookups: - source_indexes: [ifIndex] lookup: ifAlias - source_indexes: [ifIndex] # Use OID to avoid conflict with Netscaler NS-ROOT-MIB. lookup: 1.3.6.1.2.1.31.1.1.1.1 # ifName - source_indexes: [pfInterfacesIfIndex] lookup: pfInterfacesIfDescr - source_indexes: [pfLabelsLblIndex] lookup: pfLabelsLblName overrides: ifAlias: ignore: true ifDescr: ignore: true ifName: ignore: true ifType: type: EnumAsInfo pfInterfacesIfDescr: ignore: true type: DisplayString pfLabelsLblName: ignore: true type: DisplayString pfLogInterfaceName: ignore: true type: DisplayString
Prometheus Scrape Config
Once we’ve got snmp_exporter running. We must config Prometheus to collect those metrics as time series datapoints.
Refs:
    - job_name: pfsense
      static_configs:
        - targets:
            - 192.168.11.1 # pfSense host
      metrics_path: /snmp
      params:
        auth: [public_v2]
        module: [pfsense]
      relabel_configs:
        - source_labels: [__address__]
          target_label: __param_target
        - source_labels: [__param_target]
          target_label: instance
        - target_label: __address__
          replacement: prometheus-snmp-exporter:9116 # snmp_exporter server
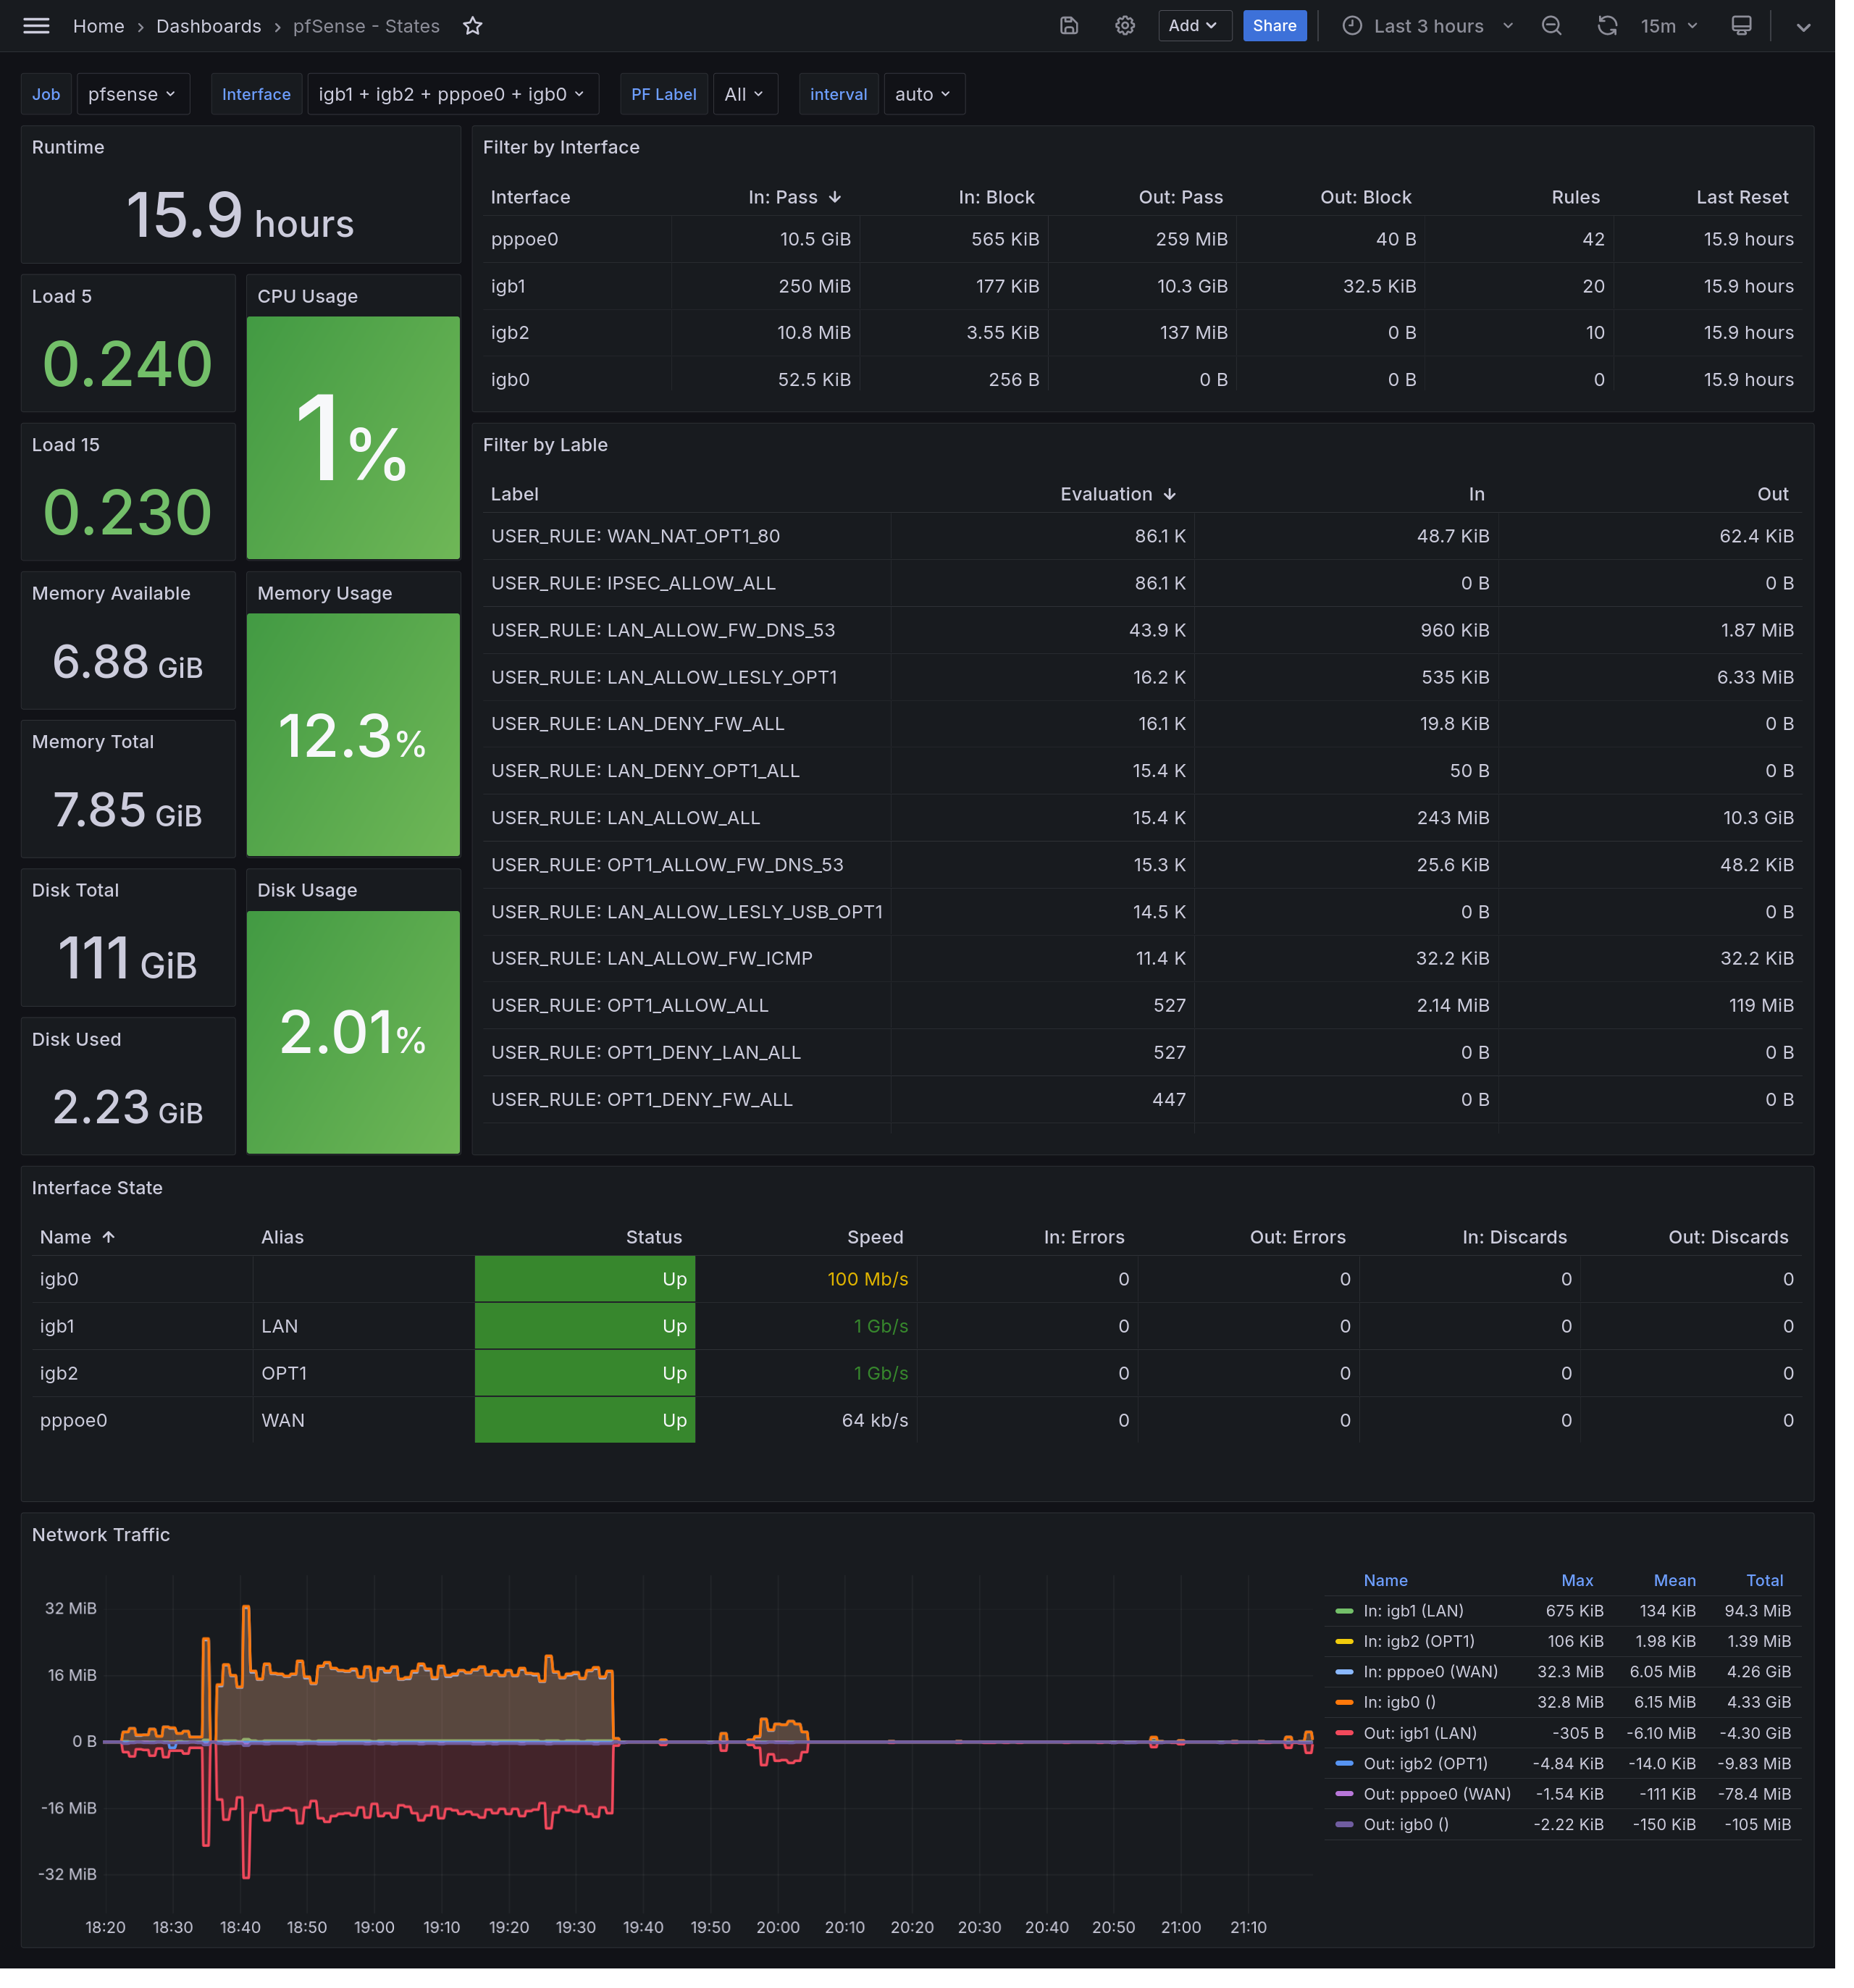
Grafana Dashboard
This is an example dashboard that consist of pfSense SNMP metrics in Prometheus. You can download and import into your own Grafana server.